---
uid: addressables-profiler-module
---
# Addressables Profiler module reference
Reference for the Addressables Profiler module. To open the Profiler, go to __Window__ > __Analysis__ > __Profiler__.
## View
To change what content is displayed, select the detail pane toolbar dropdown button **View**.
|**View**|**Description**|
|---|---|
|__Groups__| Include [groups](groups-intro.md) in the tree view.|
|__Asset Bundles__| Include AssetBundles in the tree view.|
|__Assets__| Include assets in the tree view.|
|__Objects__| Include the objects that are loaded within an asset.|
|__Assets not loaded__| Display assets that are within a loaded AssetBundle, but not actively loaded.|
## Content Tree View
You can enable or disable the Tree View columns based on your preferences. Context click on the Tree View header to display a list of the available columns.
Each column displays information depending on the content in the row:
|**Column**|**Description**|
|---|---|
| __Name__|Depending on the type, displays either:- The group name.
- AssetBundle file name.
- The address of the asset, or the asset path if the address isn't used.
- Object name, or asset type for scenes.
|__Type__| The type of the asset or object.|
|__Handles__| Number of Addressables handles that actively hold onto the content. This is often referred to as Reference Count. During loading there's an additional handle to the content.|
|__Status__| The state of the content at the time, which can be:- __Queued__: An AssetBundle is in the download queue.
- __Downloading__: An AssetBundle is being downloaded.
- __Loading__: The content is being loaded in the background.
- __Active__: The content is loaded and in use.
- __Released__: The content has been released and there are no more active handles to the content, but might still be in memory. Refer to [Memory management](MemoryManagement.md) for more information.
|
|__%__| If the **Status** is **Downloading** or **Loading**, this displays the percentage progress of the download or load operation.|
|__Source__| Displays where the AssetBundle was loaded from:- __Local__: Loaded from a local file on disk.
- __Cache__: Previously downloaded and cached to disk, and loading was from the cached file.
- __Download__: The AssetBundle hadn't been cached and needed to be downloaded.
|
|__Refs By__| Number of elements that reference this content.|
|__Refs To__| Number of elements that this content references.|
When content is released from Addressables it might still be in memory until all content from the AssetBundle is released, and any other AssetBundle that has a dependency on any asset within the AssetBundle is also released.
Released content is indicated by a faded, or grayed out font color in the Content Tree view. Refer to [Memory management](MemoryManagement.md) for more information on how Addressables manages memory.
### Filter content
You can use the search bar in the details pane to filter the content name. You can use search filter syntax to find other content:
|**Syntax**|**Description**|
|---|---|
|`h`|Search by handle.|
|`assetType`, `t`|Search by asset type.|
|`s`| Search by status|
|`rt`, `r`|Search by references to the content.|
|`rb`, `p`|Search by references by the content.|
|`bundlesource`, `bs`, `b`|Search by source.|
Filter syntax is `:`, where the field is a numerical field, for example `handles:3`. The default equality is `=`. You can change the equality to greater than `>` or less than `<` by including the symbol before the number, for example `Handles:>2`.
You can either use the column name without a space, or with the shorthand tag to filter.
You can also use the type filter to filter by inclusion type. Use `explicit` where an asset is explicitly included in a group through Addressables, or `implicit`, where the asset was included in the AssetBundle because another included references to it. For example, `type:explicit`.
## Inspect content details
When you select content from the Addressables Profiler module, the Inspector displays detailed information about the content, as follows:
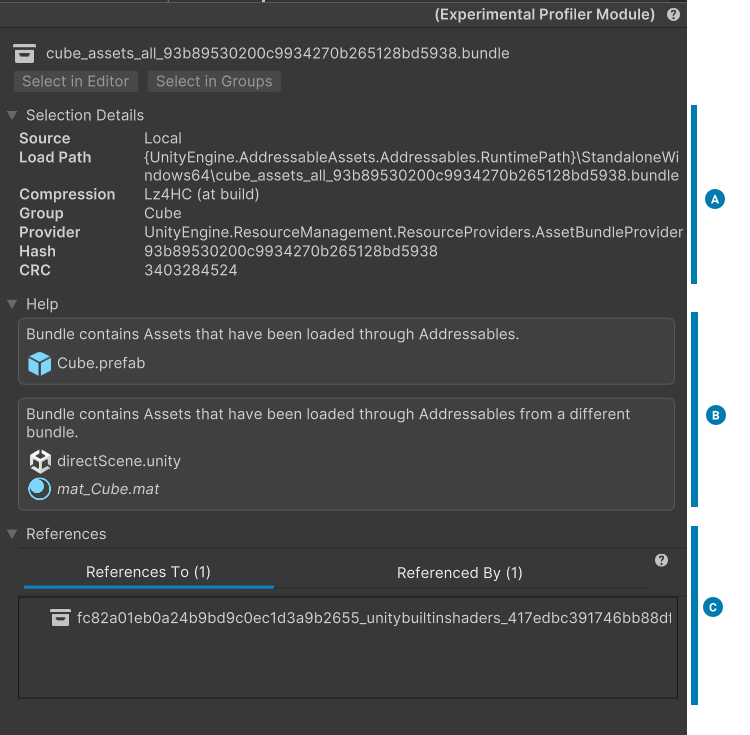
*Selected content in the Inspector*.
|**Section**|**Description**|
|---|---|
|**Selection Details** (A)| Contains detailed information, including the source, load path, compression, and group of the asset.|
|**Help** (B)| Contains information including any hints for any settings that might not be intended.|
|**References** (C)|Contains information about references to and from other AssetBundles.|
## Additional resources
* [Memory management](MemoryManagement.md)
* [Build layout report](BuildLayoutReport.md)
* [Connecting the Profiler to a data source](xref:um-profiler-profiling-applications)
* [Profiler window reference](xref:um-profiler-window)